Interactive Window/Level
Interactive window level and width adjustment
Image data sets from scanners typically include more information than can be shown on screen. For example individual image points in the data may be stored using 4096 intensity levels for 12bit data and 65536 levels for 16bit data, but they need only be represented on screen in 256 levels of grey (unless the image is colourised using the display LUT). All medical imaging workstations provide a way for the source data to be mapped to the display known as windowing. Disect Pro adopts this same technique to provide a simple method of adjusting the window level and width, which allows different tissue types and object densities visualised with ease.

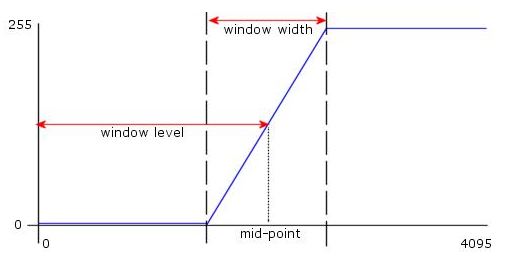
The diagram above illustrates the principle of windowing. Imagine that the horizontal (x) axis represents the intensity information in the original data, and the vertical (y) axis represents the grey level to be displayed on screen. By setting the window level we position a “window” centered at some point on this axis, and the width we choose determines its size. The original data is then remapped as shown by the blue line. Any values outside the window are changed either to pure black (left of the window) or pure white (right of the window). The intervening values are spread linearly over the remaining grey levels (0 to 255).
The effect of adjusting the window is visually similar to a change in brightness and/or contrast, except that this technique allows a very wide range of tissue types and object densities to be shown, without flooding the image with too much information. In this way small differences in incoming intensity can be shown in high contrast on the screen.
Adjusting the window level and width
There are two ways of adjusting the level and width.
The vertical scroll bars in the control panel
The advanced graphical display (see below)
Directly on the image by using the mouse
The control panel provides the most precise way of setting the window, providing you know the exact figures you want to set. There are also a number of preset values representing common tissue types, which may be selected from a drop-down list. By clicking the Advanced button a graphical display allows precise positioning of the window according to the intensity levels in the underlying data (see below).

Using the mouse to adjust the window may give a more intuitive feeling for the end result. The control panel will always reflect the settings you have made and you can return to the original settings easily by clicking the control panel’s Default button.
Saving Screenshots
Screenshots and clipboard copies
A snapshot can be taken of any of Disect Pro’s views and saved to disk as a bitmap or copied to the clipboard to paste into another application, e.g., Microsoft Word, Powerpoint, Photoshop, etc.
To take a snapshot first place the mouse over the image in Disect Pro you wish to capture. Open the pop-up menu by right clicking the mouse and select the snapshot saving option you require. The image is captured in the resolution displayed so you may wish to maximise the view and/or use the zoom feature to capture the best detail.
To copy an image via the clipboard:
1. Right-click on the desired image
2. Select ‘Copy to clipboard’ from the menu
3. Paste the file into the application you wish to receive the image
To save an image as a bitmap:
1. Right-click on the desired image
2. Select ‘Save to bitmap’ from the menu – a file save dialog will appear
3. Choose the folder and/or enter the filename then click the Save button
Zooming In and Out
Using the mouse to zoom
Each of the four views may be individually zoomed in or out as required. This is achieved using the mouse as follows.
1. Select zoom mode either from the control panel or from the pop-up menu (right-click on any 2D or 3D image)
2. Click and hold the MIDDLE mouse button on the image you wish to zoom
3. Drag the mouse to the right (zoom in) or left (zoom out)
4. Release the mouse button
Default zoom level and position

Lorem ipsum dolor siTo return to the default zoom levels and image positions, which ensures that the images fill the available viewing space, either click the Reset button on the toolbar (which resets all views), or right-click on the view you want to reset and choose Reset Zoom from the pop-up menu.
Image artifacts
The resolution of scanner images viewed in Disect Pro is determined entirely by the scanner type and settings. The resolution can range from 512 x 512 pixels for relatively low resolution scans up to 8000 x 8000 pixels and higher for very high resolution scans. When using the zoom facility in Disect Pro to zoom in on detail the image will begin to appear blocky as the pixel size in the original scan data becomes noticeable.
The following images show a 2D axial slice with a resolution of 512 x 512 pixels displayed at progressively higher zoom levels:

Annotating an image in free-hand
In Disect Pro you can annotate any of the 3D and 2D images by holding down the ‘Ctrl’ key on the keyboard then drawing with the mouse over the selected image, with the left button held down. To clear the annotation from the display simply release the Ctrl key.
If Disect Pro is being used in its conference mode where two Disect Pro stations are connected and sharing the same images, any annotations made on one station will also appear on the other. The annotations are displayed in a different colour on each display to distinguish between the annotations made on one station or the other.
Colourising an image
How is colour applied to a grey scale image?
A Look Up Table (LUT) maps one set of values to another. Disect Pro uses this technique in two areas. The first is in the interactive window/level adjustment, where the wide range of intensity values in the scanner data is mapped to a narrower range of displayable levels of grey (256 levels). The second use of the technique is in colourising the image, known as the Display LUT. This maps the 256 levels of grey from the windowing function to a set of RGBA (red, green, blue, alpha) values used in the pictorial display. This is also known as a “transfer function”.
The Display LUT is particularly beneficial for scanner data sets that do not differentiate the structure of the scanned subject in sufficient detail. It can be used to enhance differences in density by selectively fading out certain levels of grey, and by artificially colourising levels of grey according to a defined mapping.
The Transfer Function Dialog
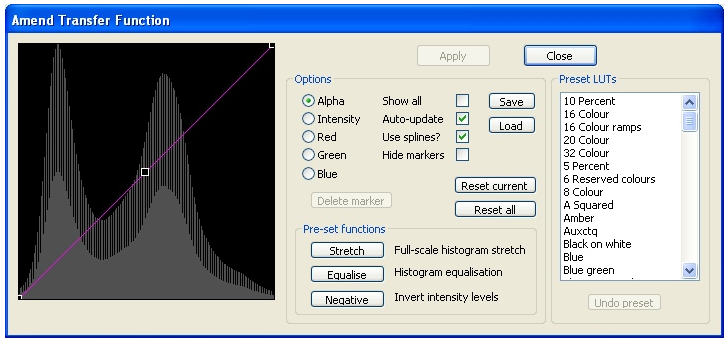
To open the Display LUT transfer function dialog select Edit / Display LUT from the main menu. The following dialog will be displayed:

A histogram shows the levels of grey present in the 3D data, with the response curve of each of the available colour channels (red, green, blue, alpha) superimposed. By default the response curves are initially straight-line 1-to-1 mappings.
The alpha channel controls the transparency of the 3D data, while the intensity channel controls the intensity/brightness. Both of these options vary RGB together.
By default the transfer functions are shown as spline curves, although a piecewise linear mapping can be made by unchecking the “Use spline” box.
To adjust the curve click and drag the control point (hollow square) with the LEFT mouse button. The appearance of the 3D and 2D images in Disect Pro is updated in real time as the changes are made. To add a control point on the curve click with the LEFT mouse where the new point is required. There is no limit to the number of control points that can be added. To remove a control point select it with the mouse (it will turn white) then click the Delete Marker button.
The dialog includes a large number of preset LUT’s listed in the box on the right which can be selected by first left clicking with the mouse, then stepping through the options with the up/down arrow keys on the keyboard until the desired one is found. No single LUT preset is equally effective on all scanner data sets so a certain amount of experimenting may be necessary to find the optimum LUT for the data set being used. Or design your own.
Saving the Display LUT
If you have a produced your own LUT clicking on the Save button will store the settings to disk. You can re-apply the same LUT in later sessions by clicking the Load button.
Example
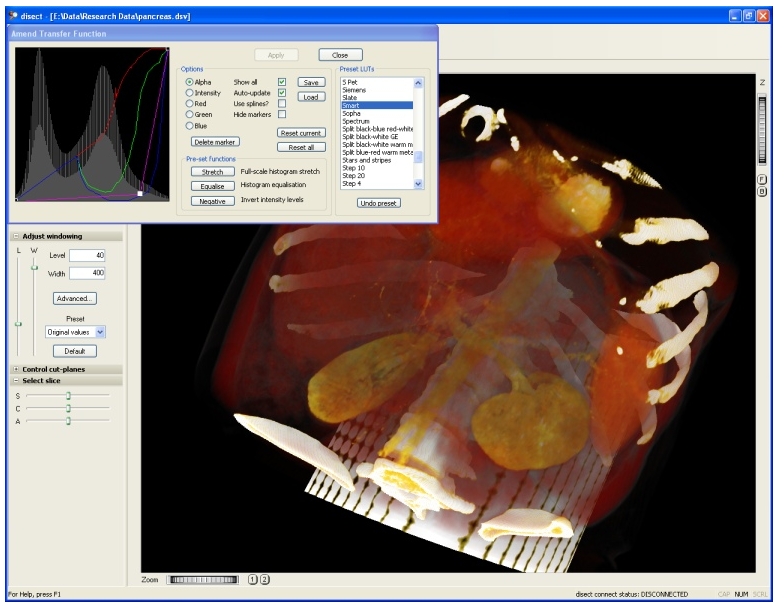
The following screenshot shows the LUT in action. In the display below the alpha response has been adjusted to render some tissue types transparent and a colour mapping has been applied to highlight different tissue types:
